Hi, my name is
Benjamin Chaffe.
I'm a graduate in Economics and Mathematics.
I develop apps for iOS such as Liquify, a water tracking app. I also use various coding languages for data analysis and to create visualisations.
01. About Me
Hello! My name is Benjamin, or Ben as most people know me. I began programming when I was playing Minecraft as a way to create new game items and mods.
Fast forward quite a few years and now I have taught myself numerous programming languages, completing projects in web development, game design, app development and data analysis.
I most recently developed an iOS app called Liquify using SwiftUI, which was an Apple App of the Day in 2021.
Languages
- Swift
- Python
- R
- HTML, CSS, JS
- Java
- C++
- SQL

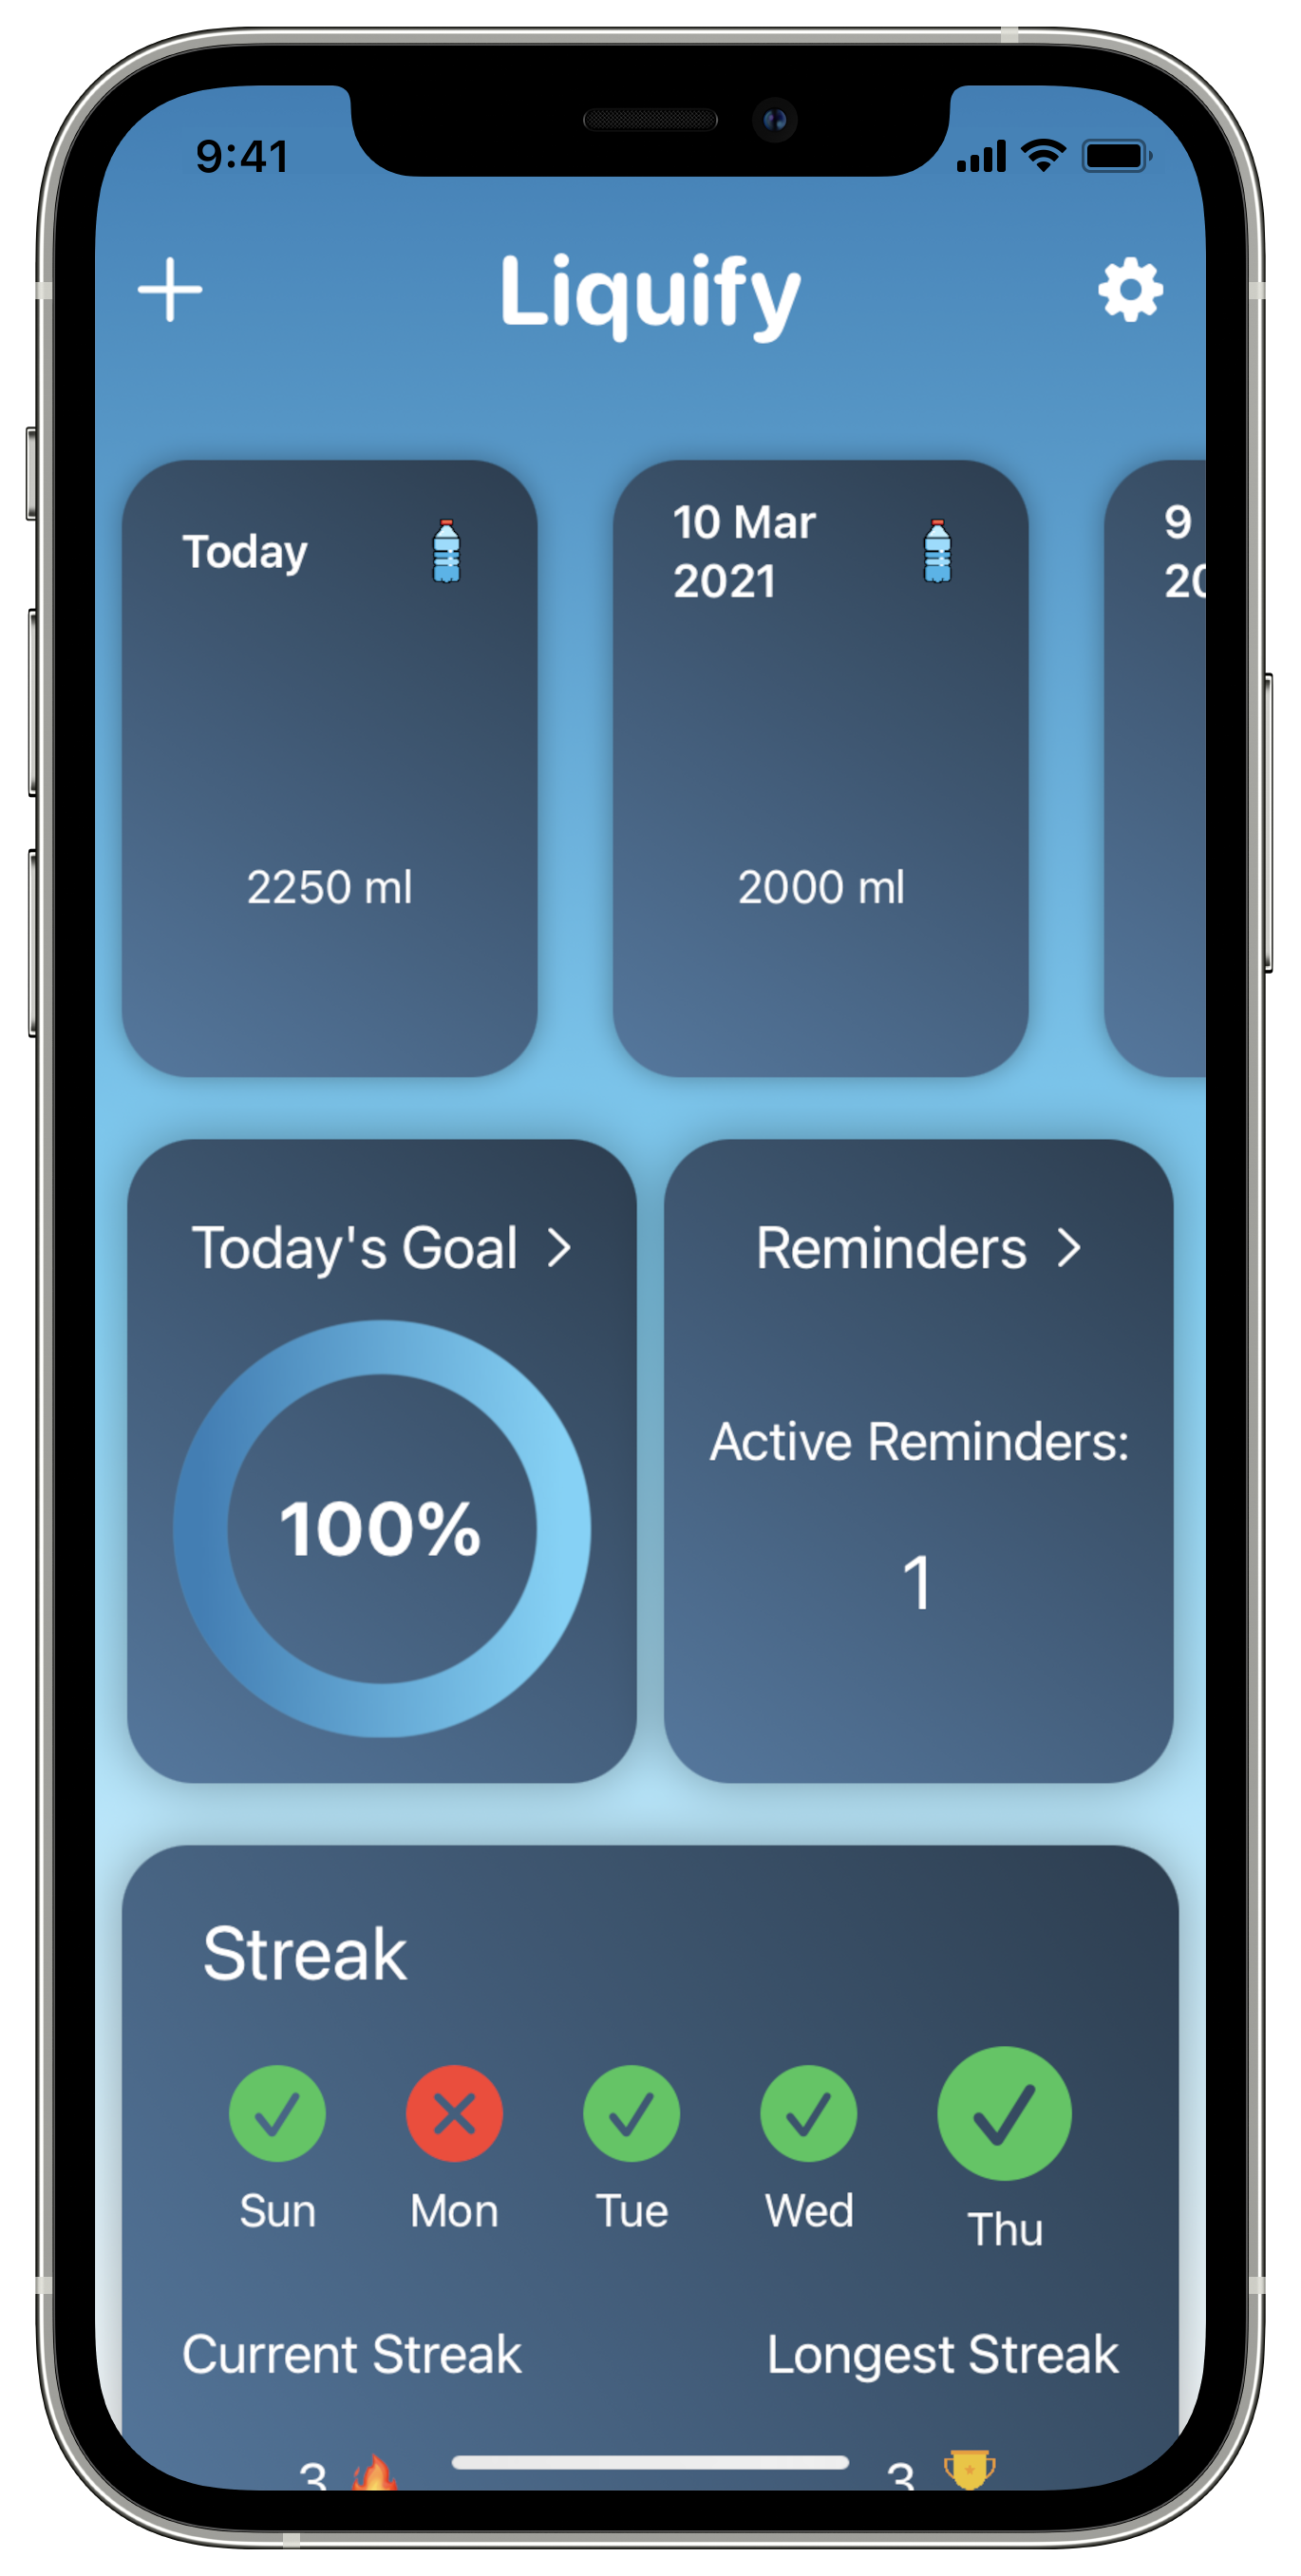
Liquify - Daily Water Tracker
Liquify is a drink tracking app made with SwiftUI. It is designed for iOS and has a Apple Watch app to track on the go. The aim of the app is to help people understand where they get their water intake from and how important it can be for their health.
This was the first app I developed after teaching myself Swift and SwiftUI over lockdown. It makes use of technologies such as HealthKit, Firebase for analytics and push notifications, RevenueCat for in-app subscriptions, CloudKit for data transfer and many more.
More Info
- Over 30k downloads
- Apple App of the Day in 43 countries
- Featured in over 50 countries
- Rated 4.7/5 on the App Store
- Developed, designed and marketed by me
- Freemium business model
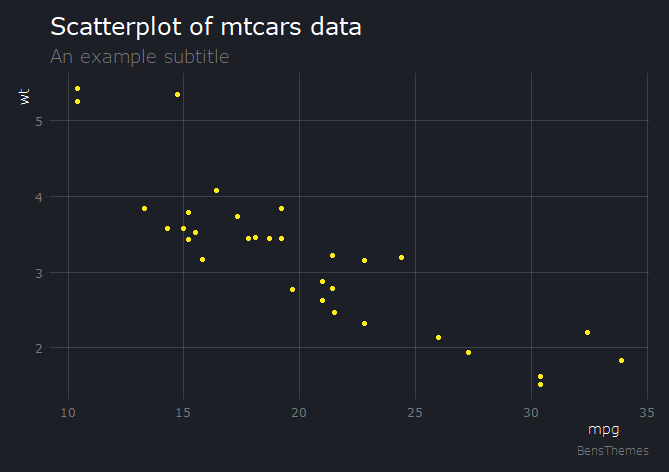
BensThemes
BensThemes is an R package which contains custom themes for ggplot2. I created this for personal use to quickly style charts I made using ggplot2. It is on GitHub and available for others to download with instructions.
The package contains 6 themes which are light gray, white, blue, dark, retro and a lighter dark theme. On GitHub there are instructions on how to use each theme including any other customisation options.
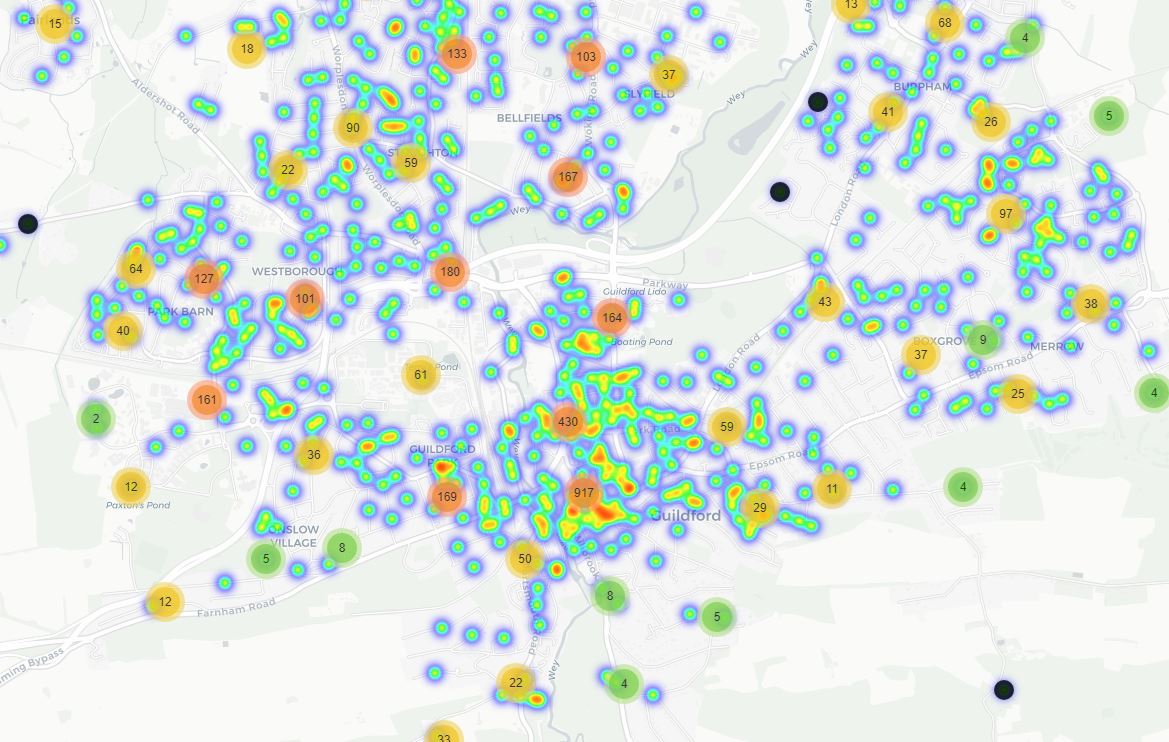
Surrey Crime Map
This is a map exploring crime in Surrey using R, leaflet and shiny. It is hosted as a shiny app at the link below.
It maps crime in Surrey from December 2019 to May 2020. You are able to filter the data by the month and the type of crime.
Lego Analysis
This is an analysis of the Rebrickable data set on all lego sets sold (as of May 2020). It was completed using R and R Markdown to present. Lego was one of my favourite toys and I was always excited to open and put together a set at Christmas.
Throughout it I use dplyr, ggplot2 and plotly. It includes analysis on the most common spare bricks, number of sets released per year and more.

E-Cigarettes
I analysed the use of E-cigarettes in Great Britain using a dataset from the ONS. I created an artcile style presentation of the data using a chart style inspired by The Economist magazine.
I used R to complete it and ggplot2 for the graphs. It looks into the people using E-cigarettes, why they are using them and if they are an ex-smoker or not. It would be interesting to revisit this after the rise in popularity of disposable vapes.

Credit Card Fraud Detection
Here I used Python and machine learning to detect credit card fraud. It was my first use of machine learning to explore how it can be used in real world scenarios.
It is presented using a Jupyter notebook and makes use of package such as tensorflow, matplotlib, numpy and more.